Find the 95% CI on a point estimate
This simple approach is based on the formula
\(\LARGE p ± Z * \sqrt\frac{p(1-p)}{n}\)
Where
\(\LARGE p\) = point estimate
\(\LARGE Z\) = Zcrit value for 95% confidence level (i.e. 1.96 for a 95% confidence interval)
\(\LARGE n\) = sample size
Libraries
── Attaching core tidyverse packages ──────────────────────── tidyverse 2.0.0 ──
✔ dplyr     1.2.1     ✔ readr     2.2.0
✔ forcats   1.0.1     ✔ stringr   1.6.0
✔ ggplot2   4.0.3     ✔ tibble    3.3.1
✔ lubridate 1.9.5     ✔ tidyr     1.3.2
✔ purrr     1.2.2
── Conflicts ────────────────────────────────────────── tidyverse_conflicts() ──
✖ dplyr::filter() masks stats::filter()
✖ dplyr::lag()    masks stats::lag()
ℹ Use the conflicted package (<http://conflicted.r-lib.org/>) to force all conflicts to become errors
Define Some data
= tibble (month = 1 : 10 ,prevalence = c (0.72 ,0.62 ,0.44 ,0.22 ,0.17 ,0.12 ,0.13 ,0.09 ,0.04 ,0.02 )kable (df)
1
0.72
2
0.62
3
0.44
4
0.22
5
0.17
6
0.12
7
0.13
8
0.09
9
0.04
10
0.02
Define a function to calculate upper and lower confidence interval
<- function (p,z= 1.96 ,n){z * sqrt ((p* (1 - p))/ n)}
Capture the upper and lower limit for a given value of n
<- df %>% mutate (upper10 = prevalence + point.estimate.CI (prevalence,n = 10 ),lower10 = prevalence - point.estimate.CI (prevalence,n = 10 ),upper50 = prevalence + point.estimate.CI (prevalence,n = 50 ),lower50 = prevalence - point.estimate.CI (prevalence,n = 50 ),upper1000 = prevalence + point.estimate.CI (prevalence,n = 1000 ),lower1000 = prevalence - point.estimate.CI (prevalence,n = 1000 )
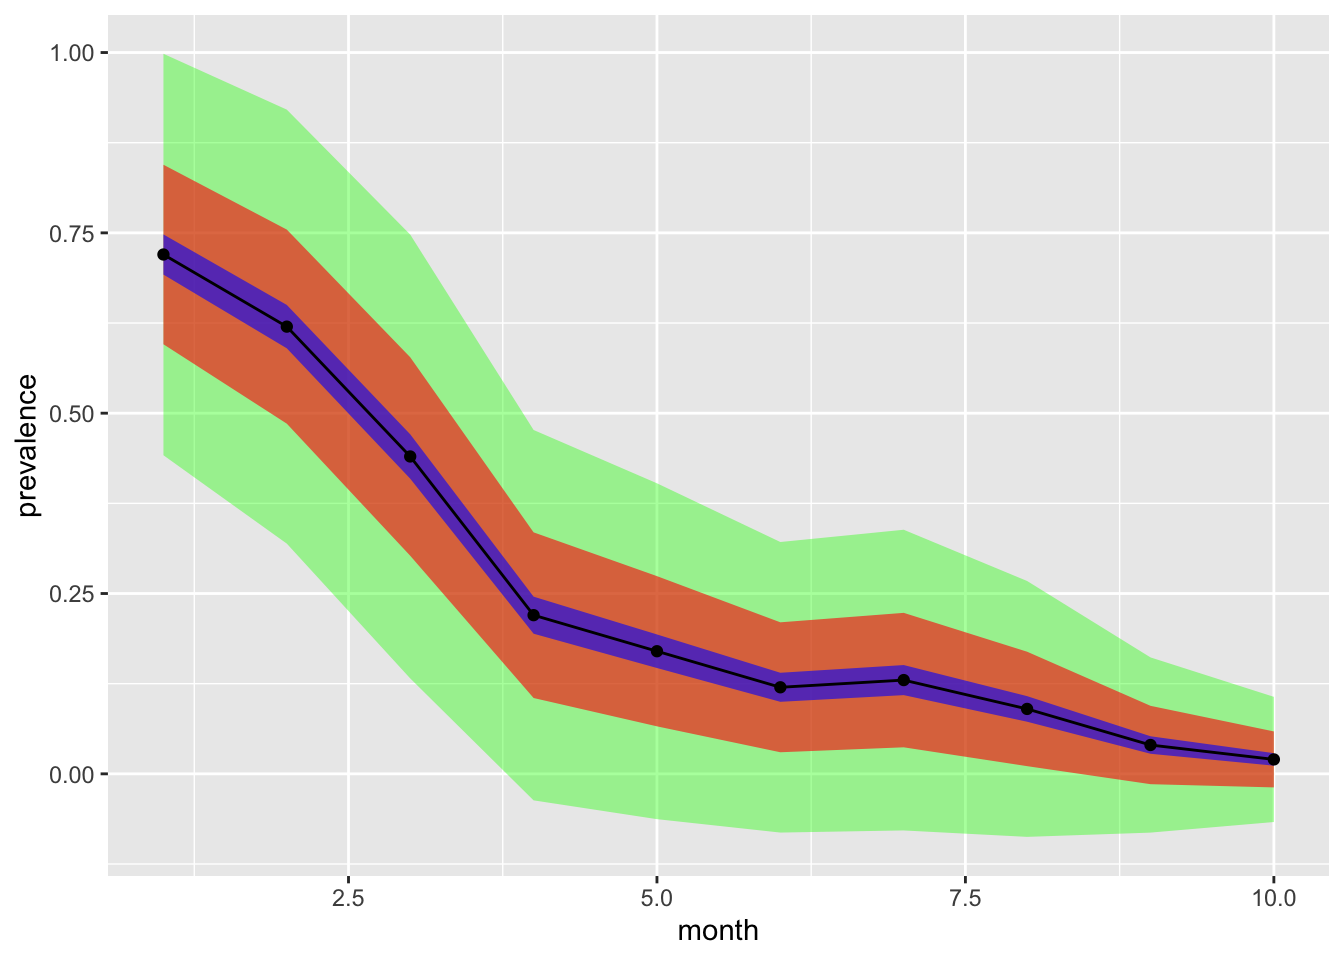
Draw the confindence intervals
This chart shows the point estimates (black dots) as well as the 95% confidence intervals obtained when n was 10 (green ribbon), 50 (red ribbon) or 1000 (blue ribbon)
ggplot (df,aes (month,prevalence))+ geom_ribbon (aes (x = month,y= prevalence,ymin= lower10,ymax= upper10),alpha= 0.4 ,fill= "green" )+ geom_ribbon (aes (x = month,y= prevalence,ymin= lower50,ymax= upper50),alpha= 0.6 ,fill= "red" )+ geom_ribbon (aes (x = month,y= prevalence,ymin= lower1000,ymax= upper1000),alpha= 0.6 ,fill= "blue" )+ geom_point ()+ geom_line ()